I have always been a passionate promoter of data visualization, but it wasn't until I started connecting the dots between the ERP and the MES, and even some various Excel files we used in the company, that I was able to convince my whole audience of the reach and consequentially of the power of a good, on spot, data viz.
Using Tableau, a data visualization software focused on business intelligence, after some time figuring out the meaning of each of the hundreds of columns through dozens of data tables, connecting the pieces of information across various sources, I was able to create interactive pages that could inform, alert and empower our managers.
The access to most of the information I was giving to my colleagues may - or should - be given for granted, but in most manufacturing companies, our included, it takes a very intricated way to get to those data without such tools.
Now with just a click on a web page or an app, everyone in the organization can access a personalized set of tables like:
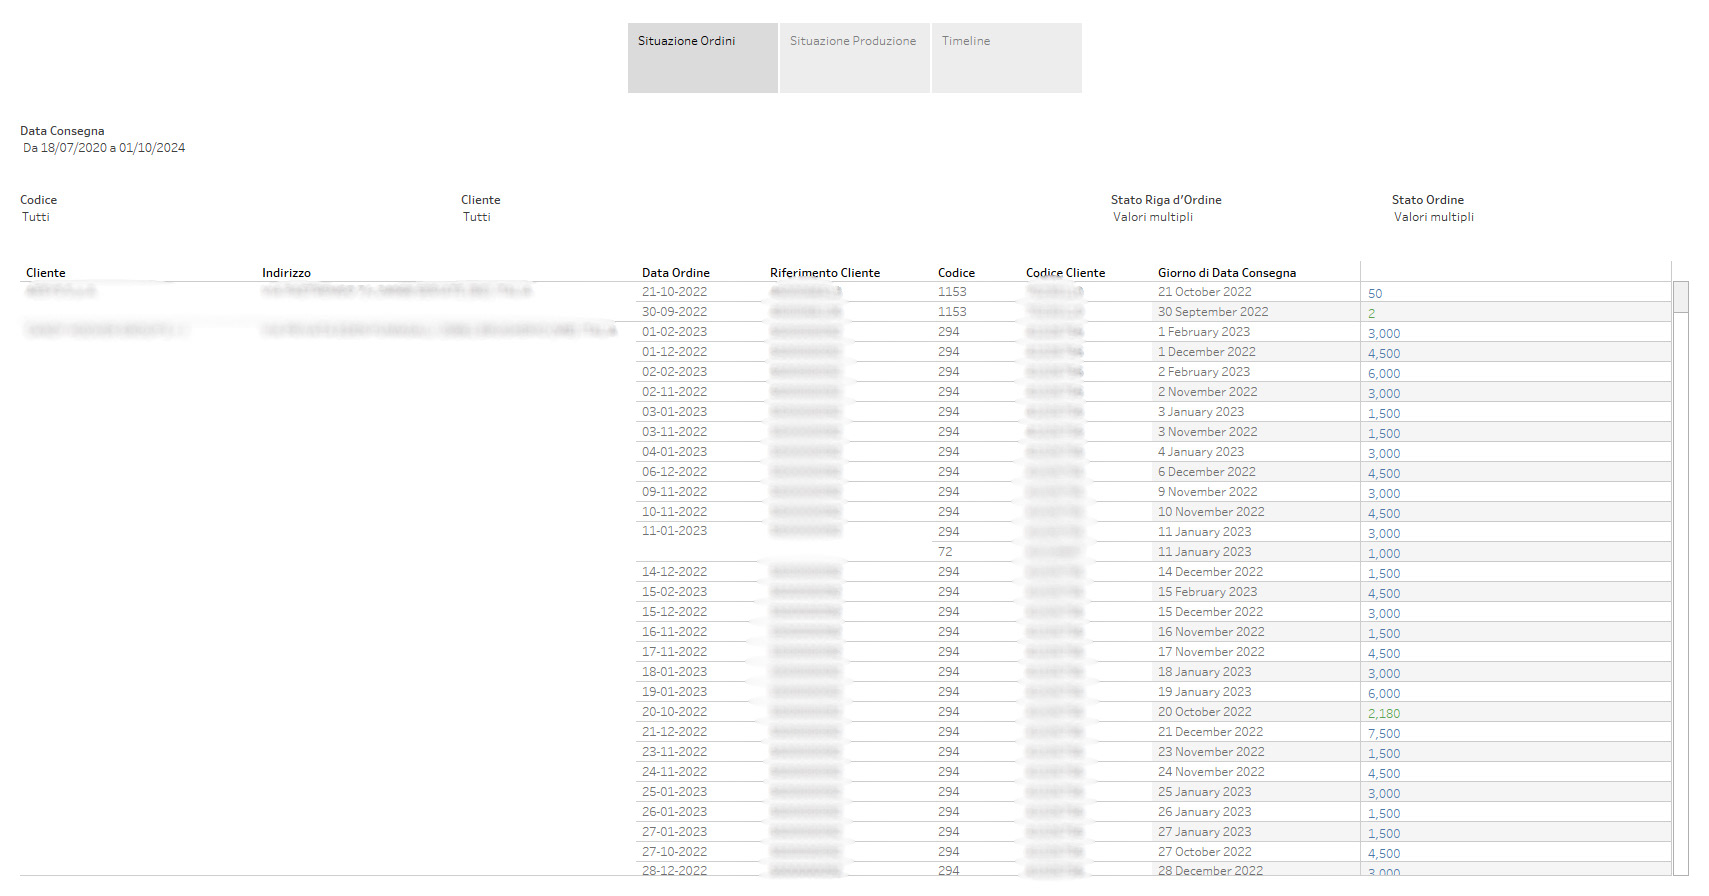
ORDER MANAGEMENT
in just 3 views the planning manager has:
- A list of all the existing orders for every customer with their delivery date, actual status and a color-coded alarm on expected delivery (based on the production speed from the technical sheet of every article)
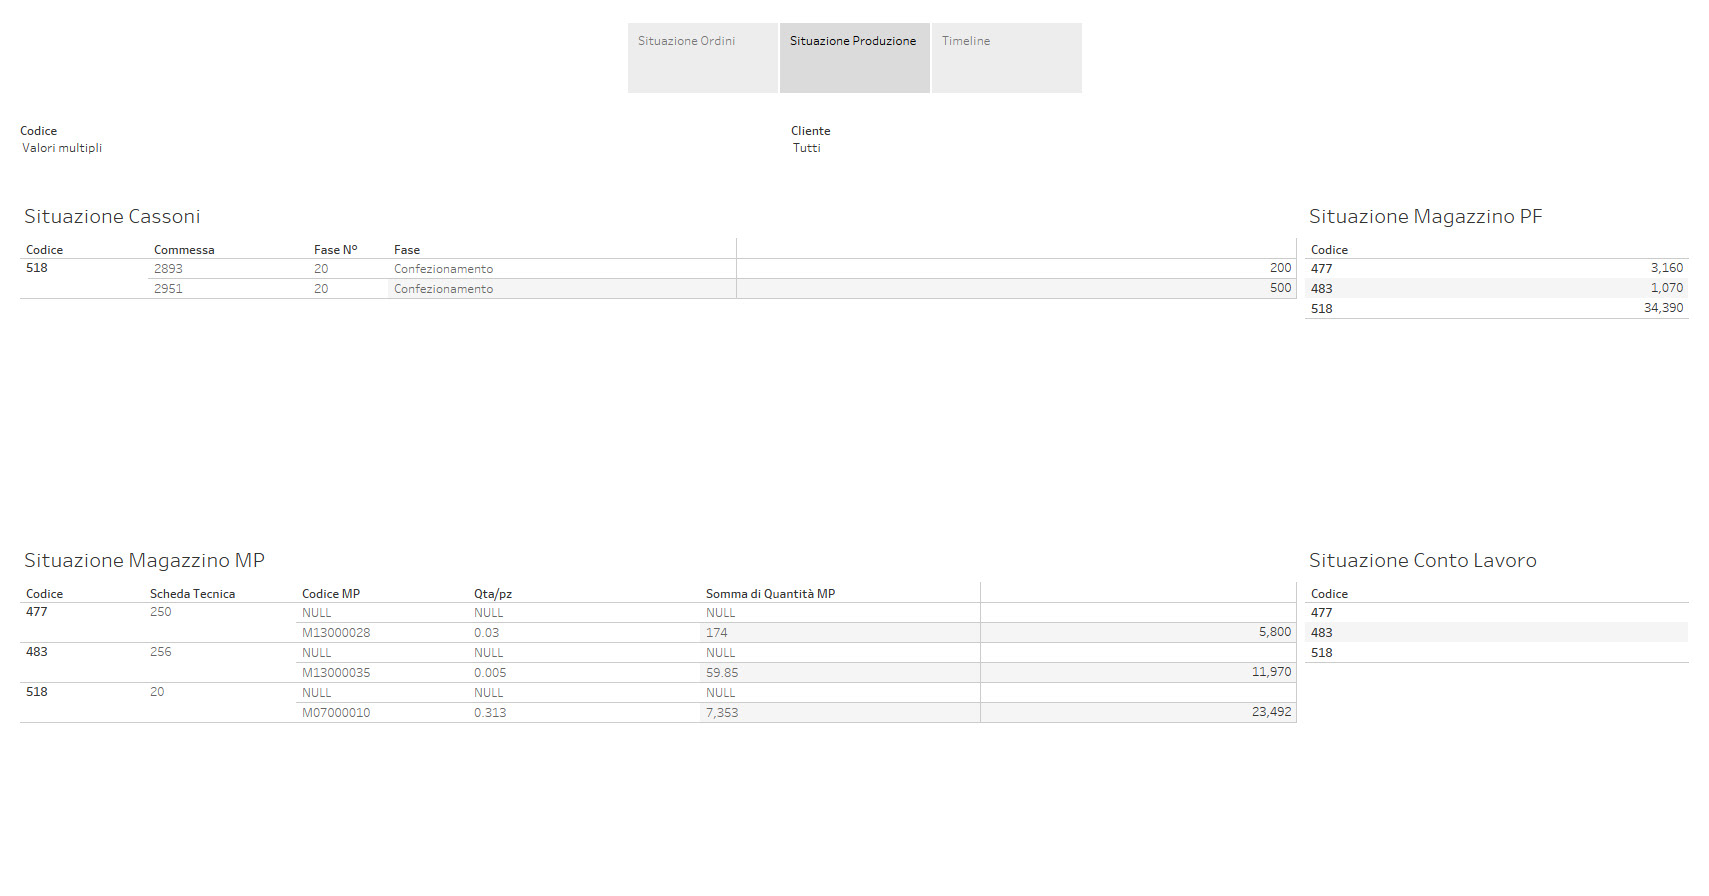
- A summary (for every part selected) of the finished goods in the warehouse as well as any batch in production (with its phase) or at a supplier, but also the relative amount of raw material with the expected producible amount of parts (based on the raw material requirements from the technical sheet of every article)
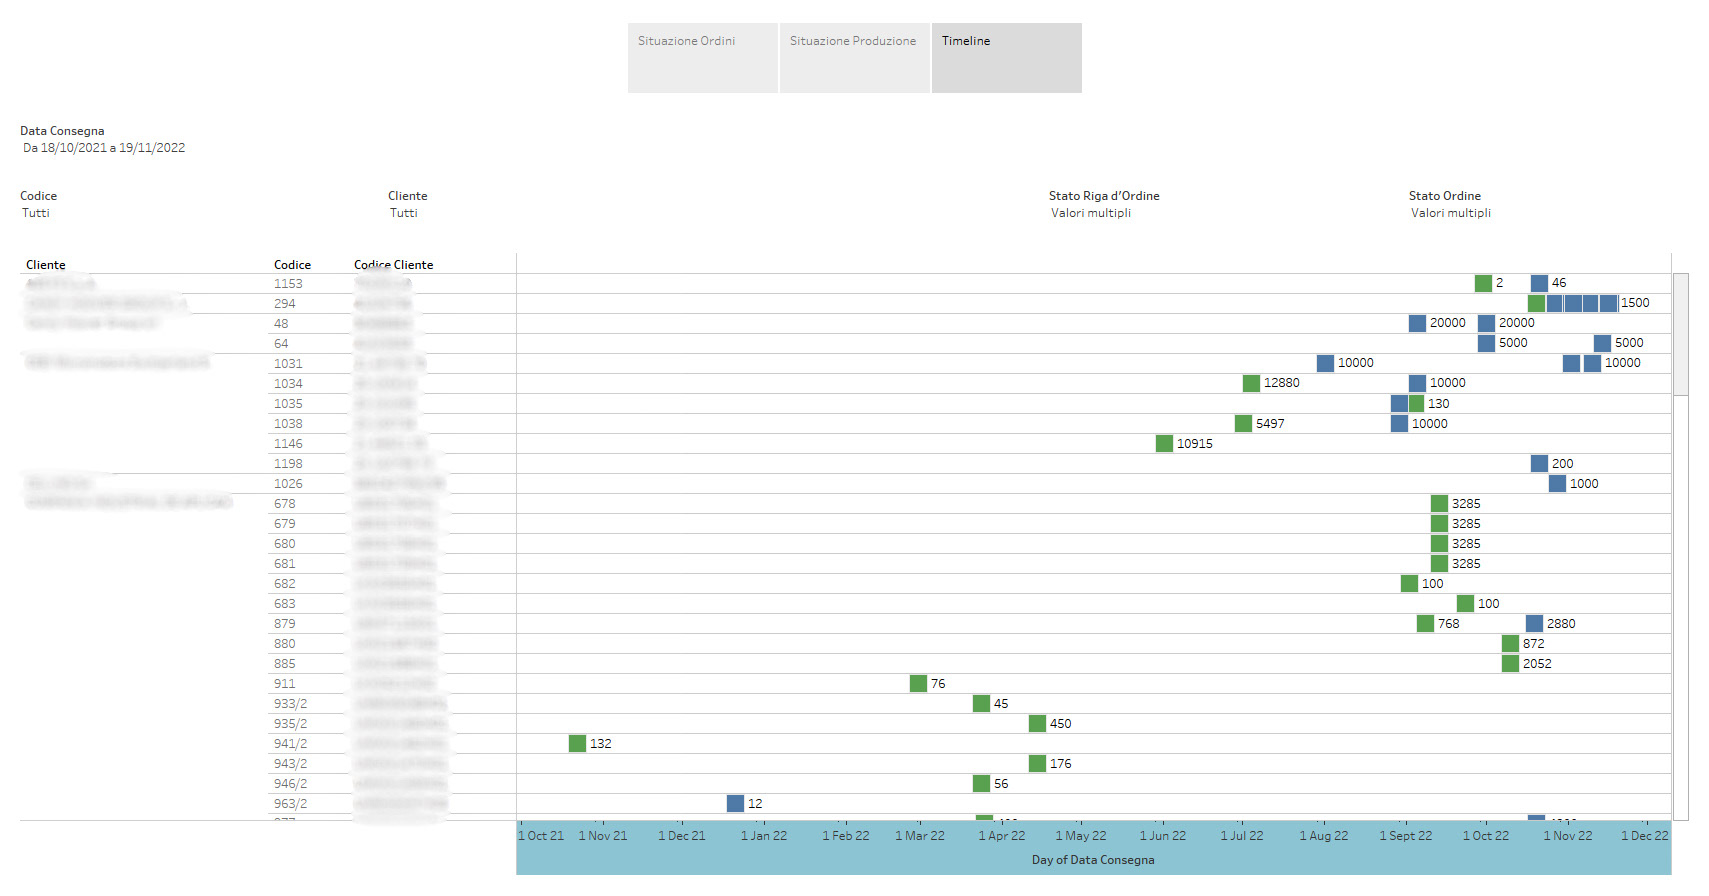
- A timeline of the orders based on the existing machine planning Gantt (with color-coded alerts
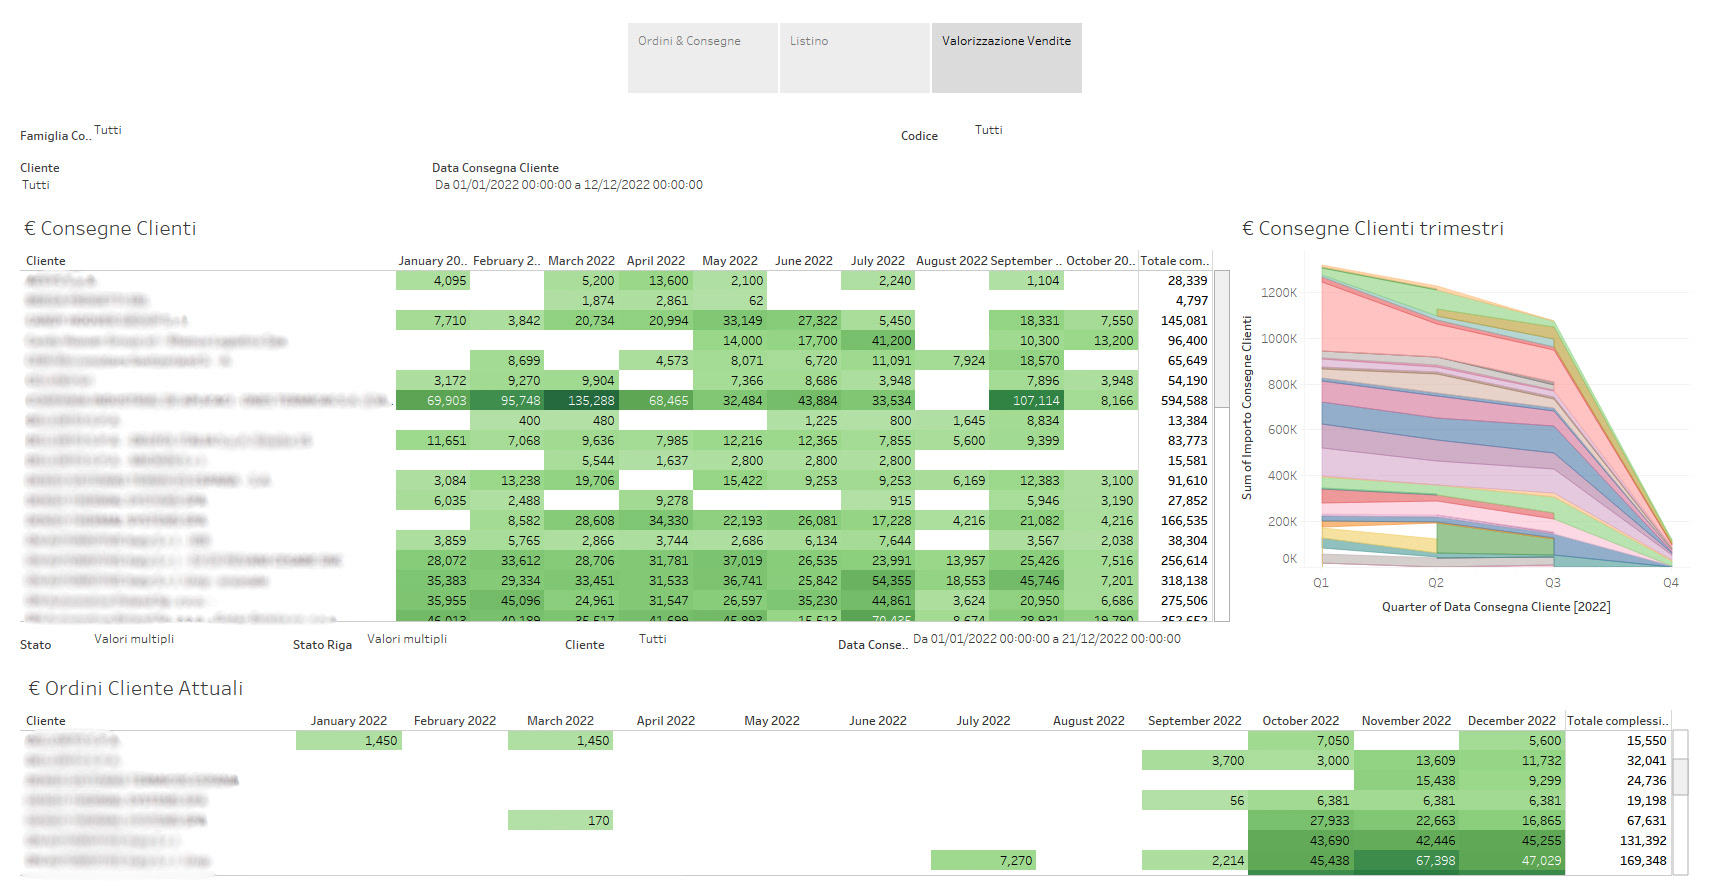
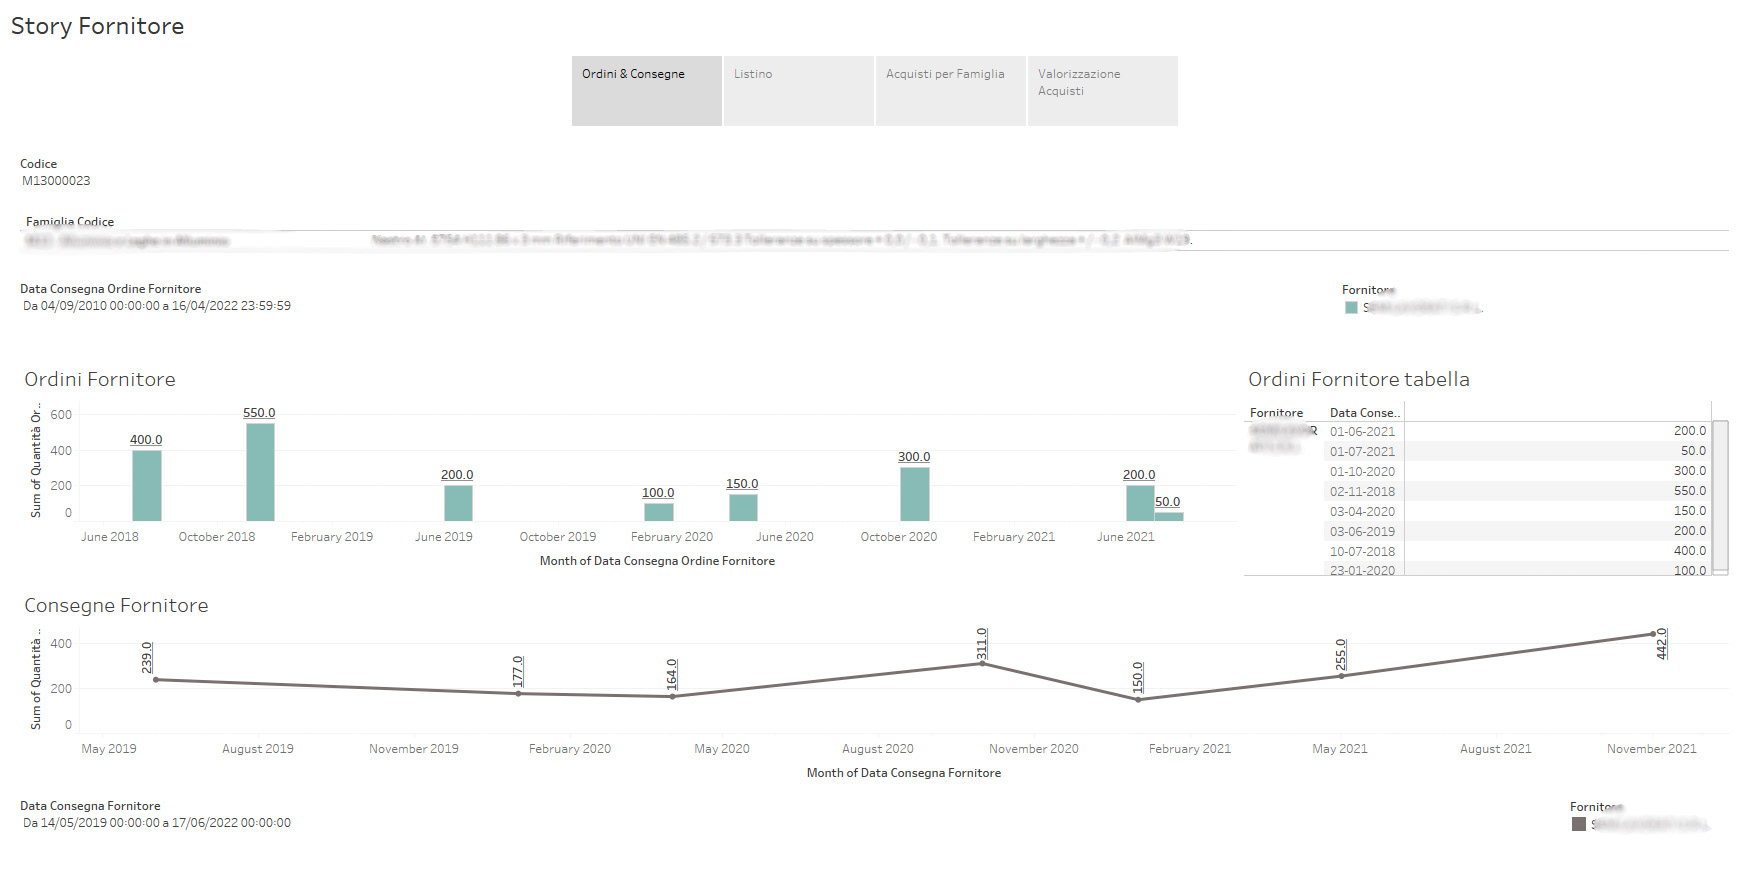
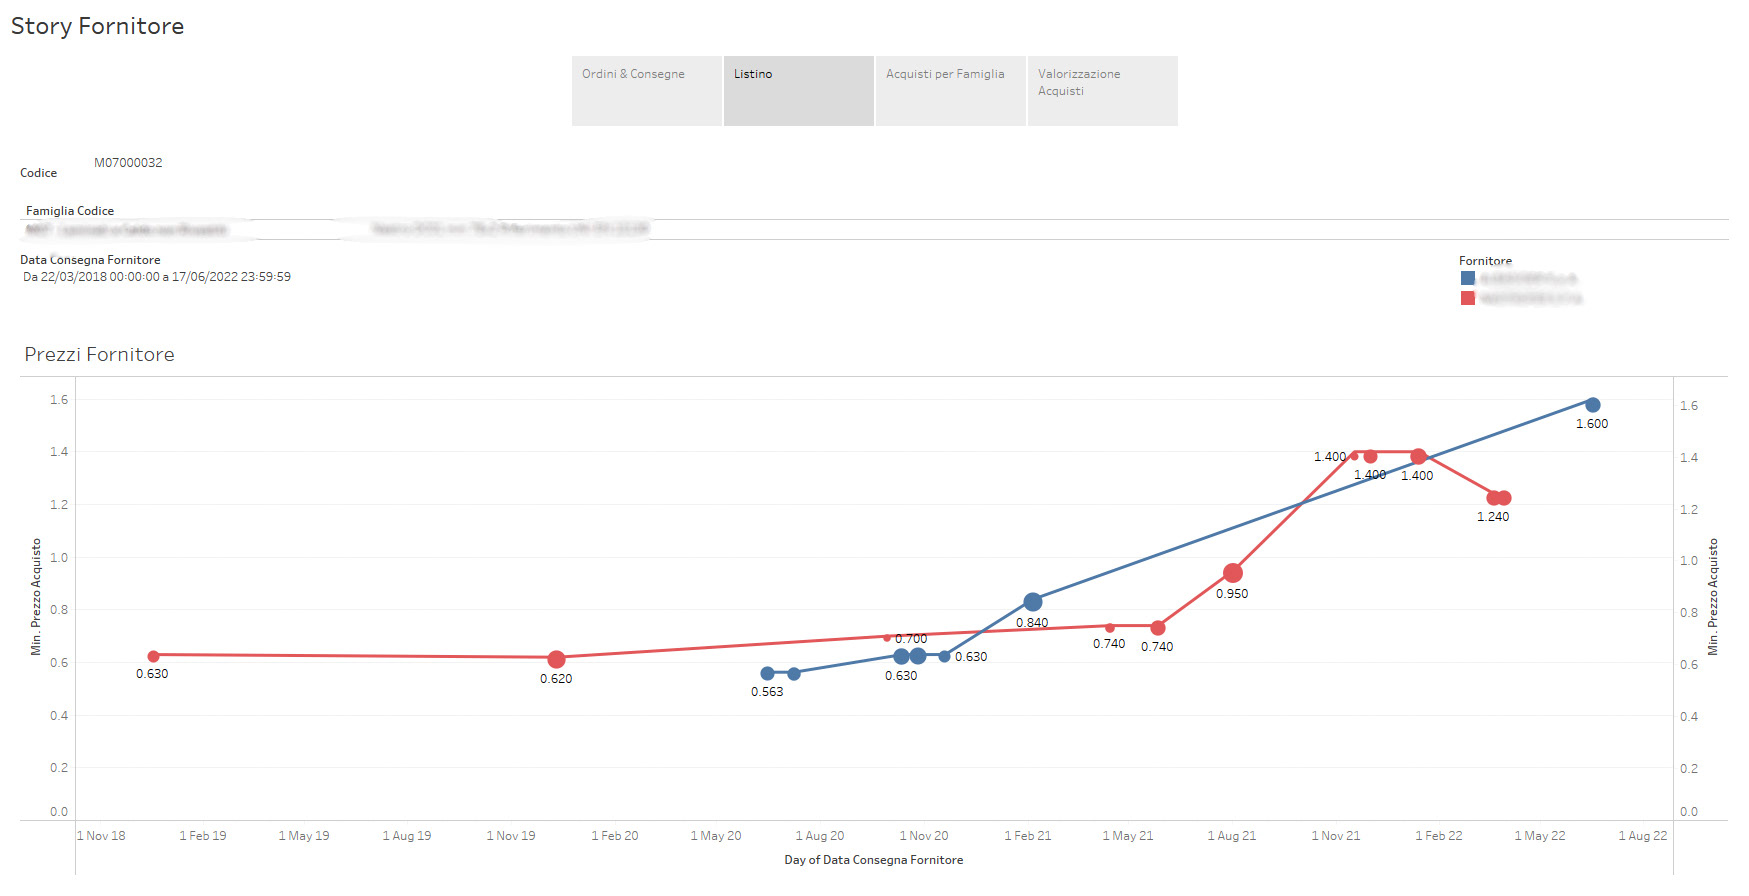
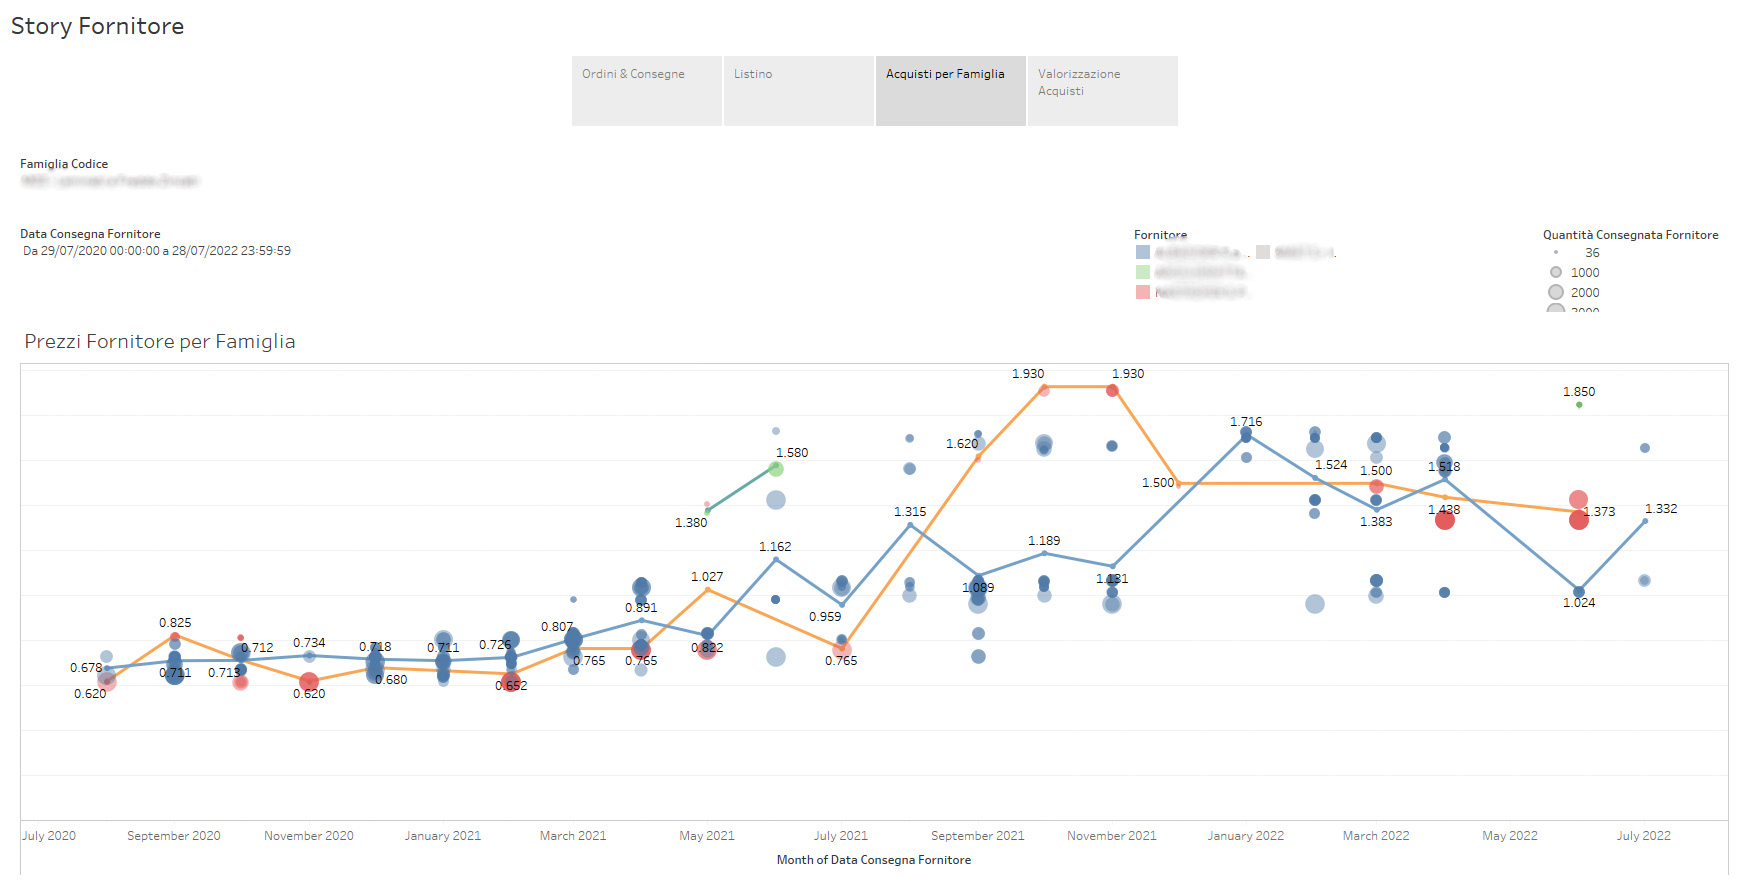
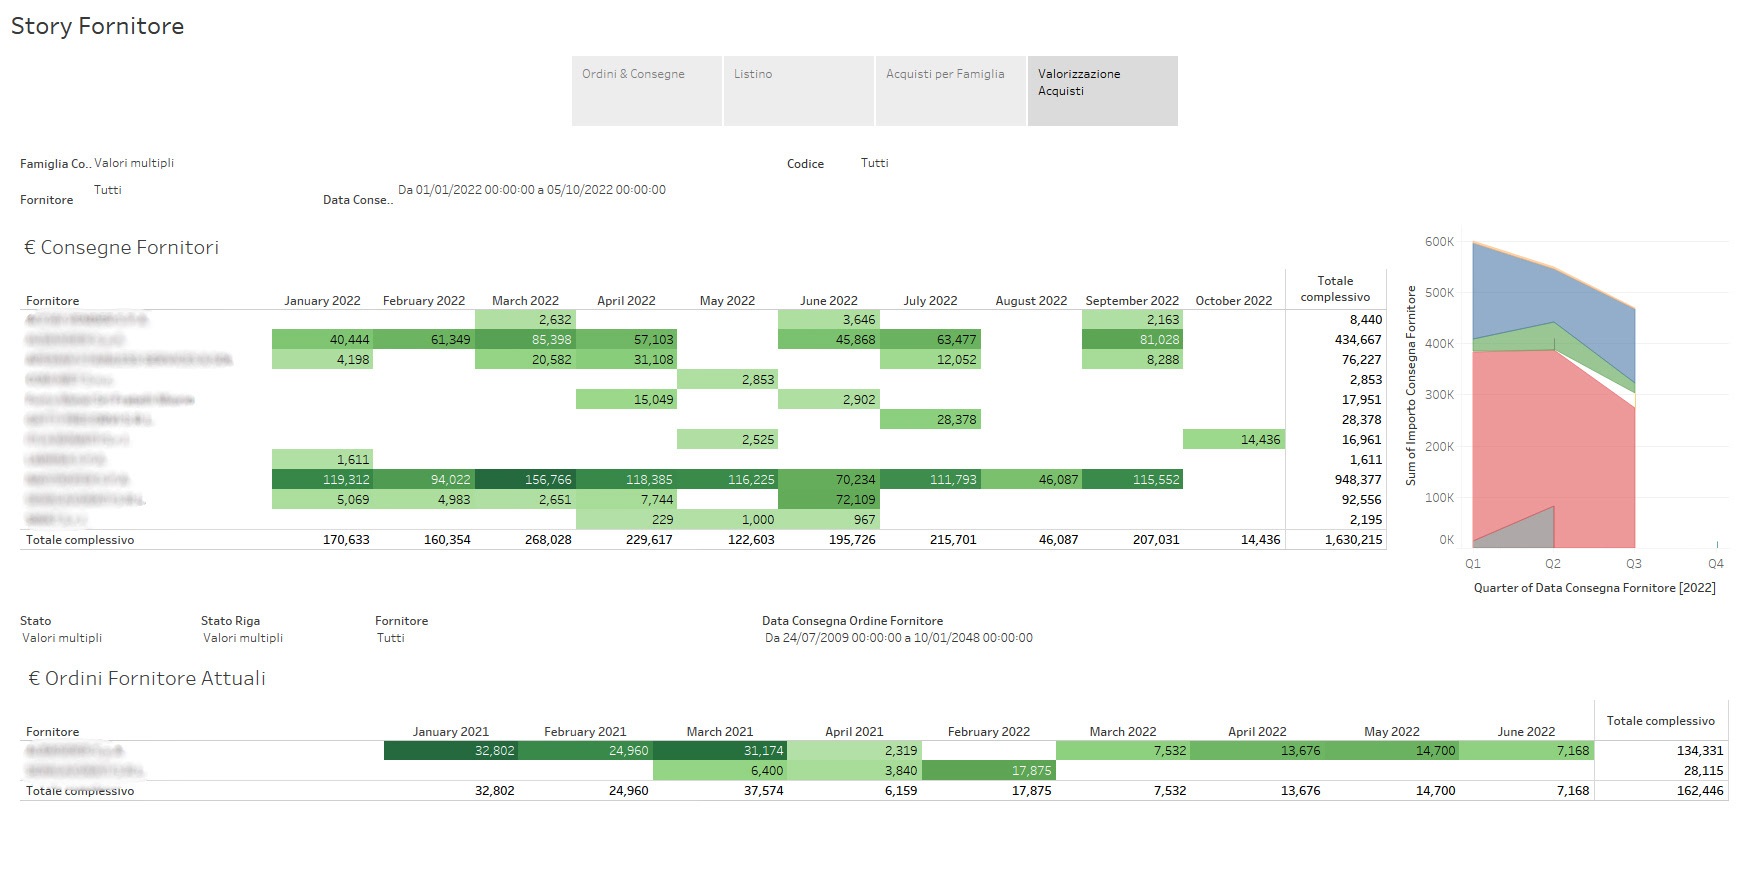
CUSTOMERS AND SUPPLIER SUMMARY
In two different "stories", the sales, planning, and procurement managers can have a summary of the most important pieces of information about suppliers or customers such as:
- The trend of volumes ordered or delivered for every article
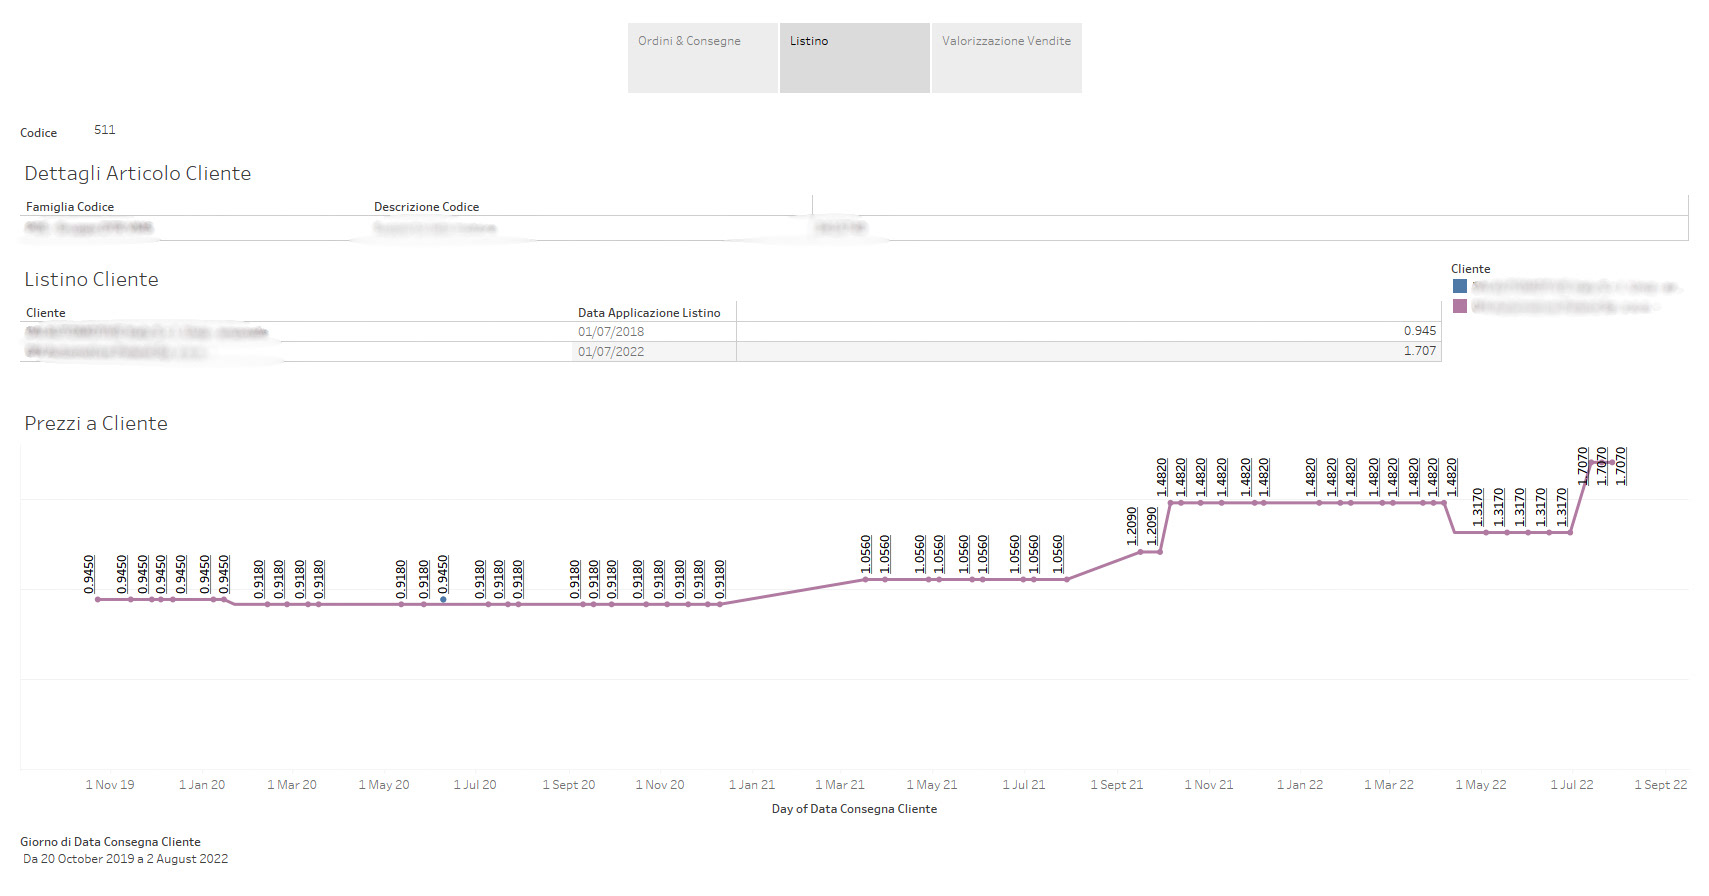
- The various price lists across different customers or suppliers through time
- The various price lists and volumes ordered aggregated for families across different suppliers (not available for customers, it wouldn't make sense)
- The revenues or costs generated by any customer or supplier through time and a forecast based on the open orders

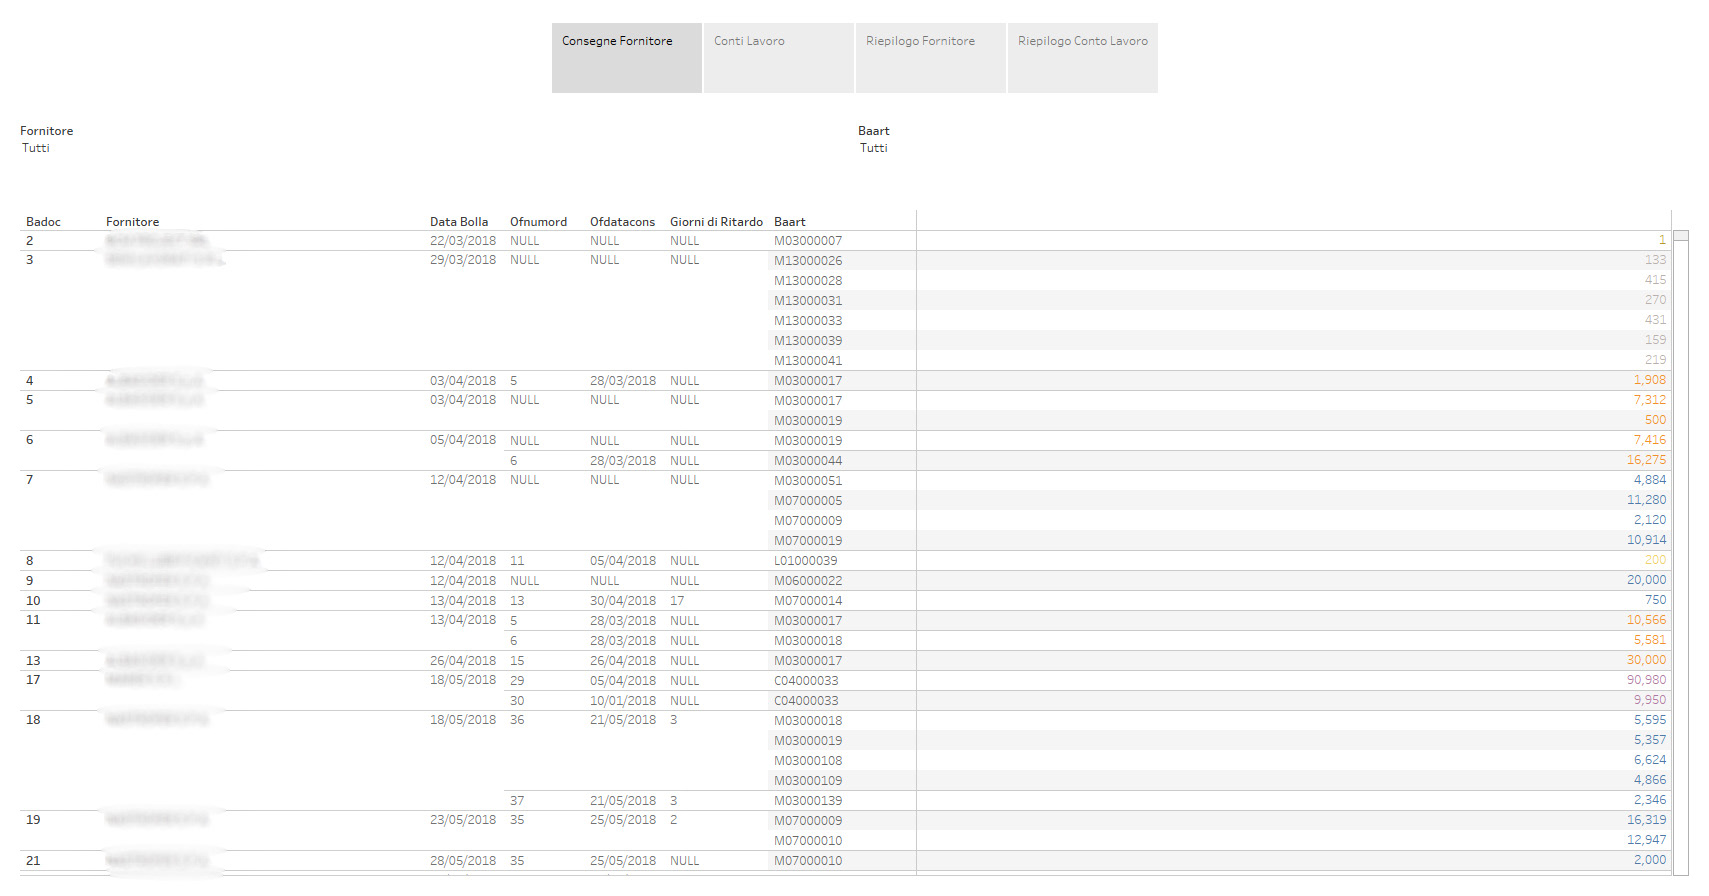
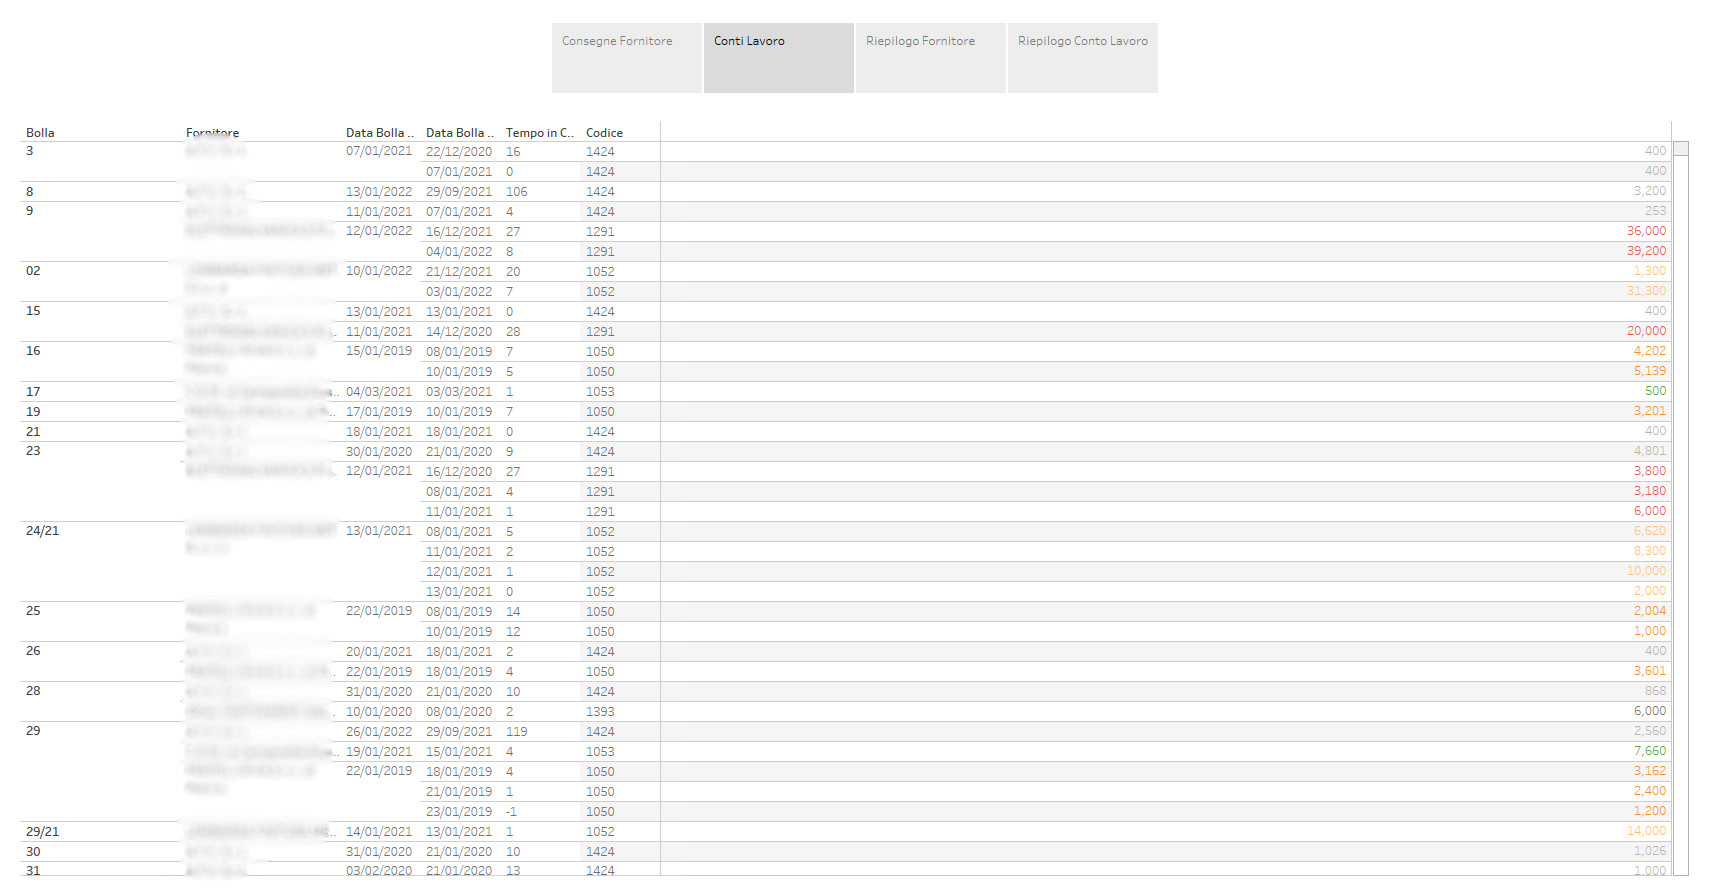
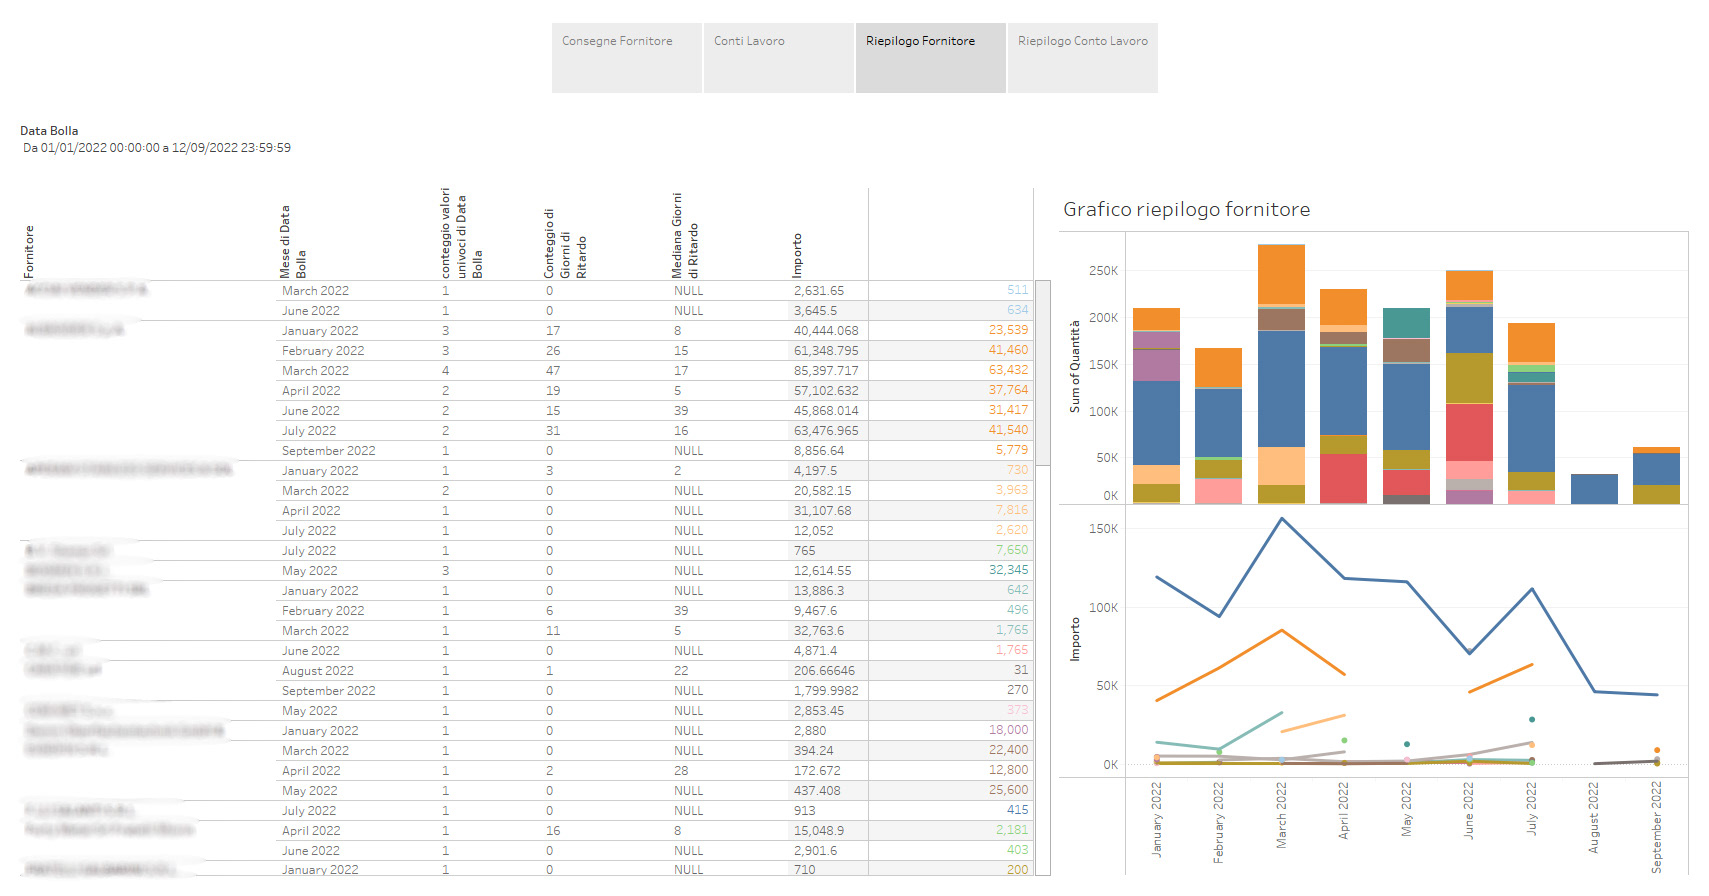
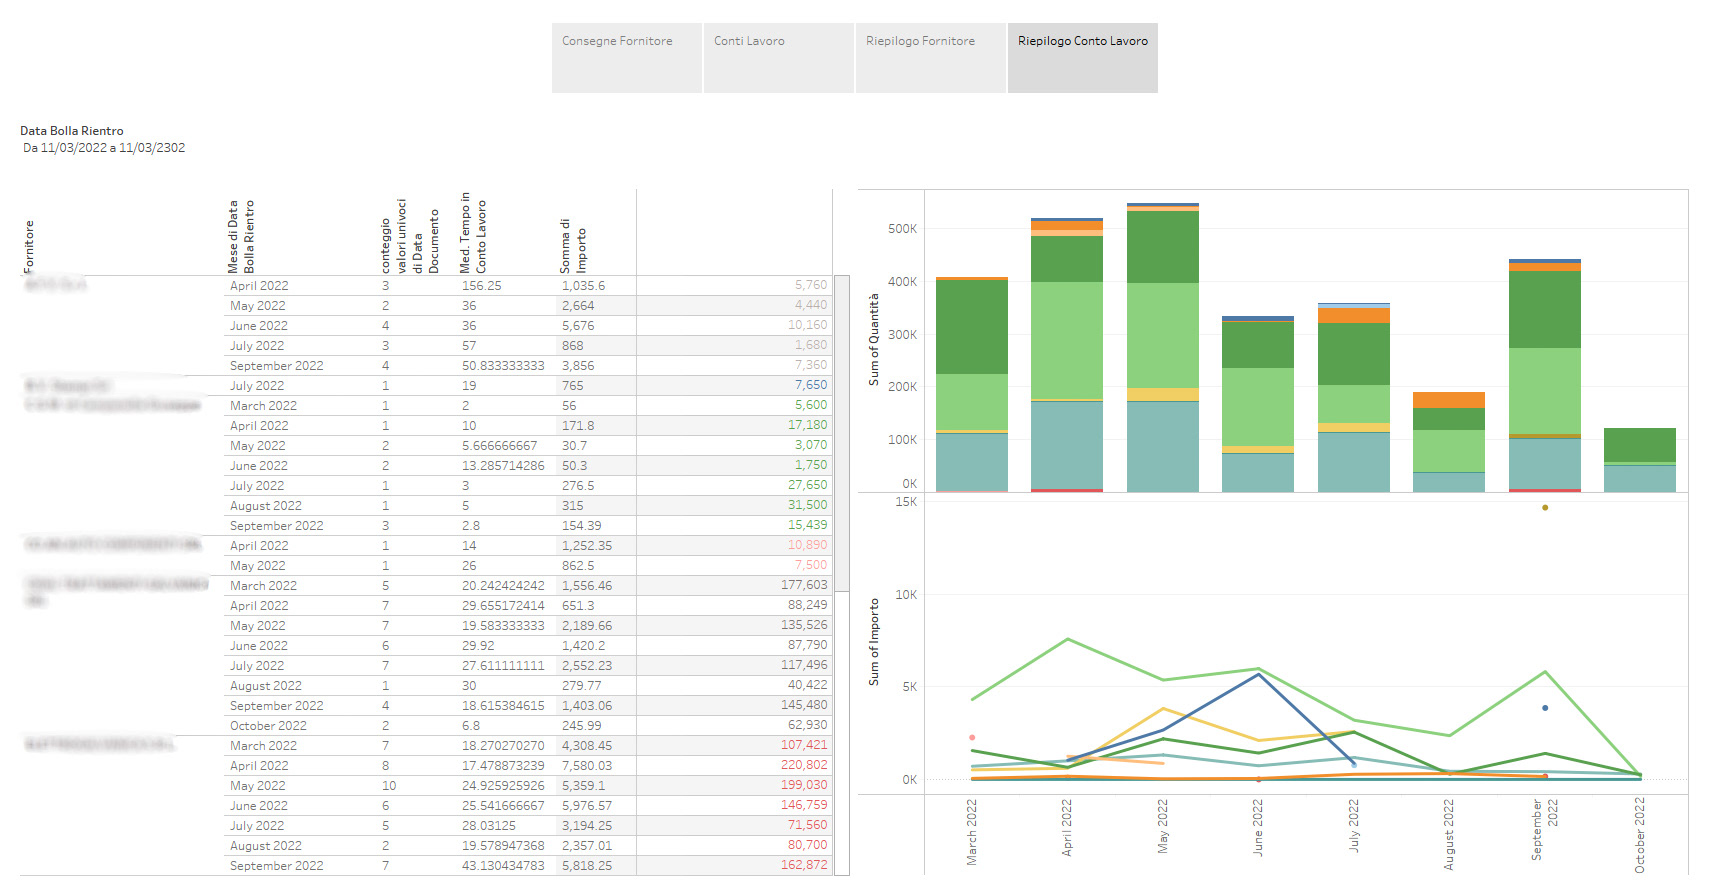
SUPPLIERS DEEP DIVE
At any given time the procurement, quality, and planning managers can see:
- A complete list of all the deliveries made by any supplier
- The quantity processed (in parts, kgs or €), the number of delays, the median, and the average throughput time for any given period of time for every supplier
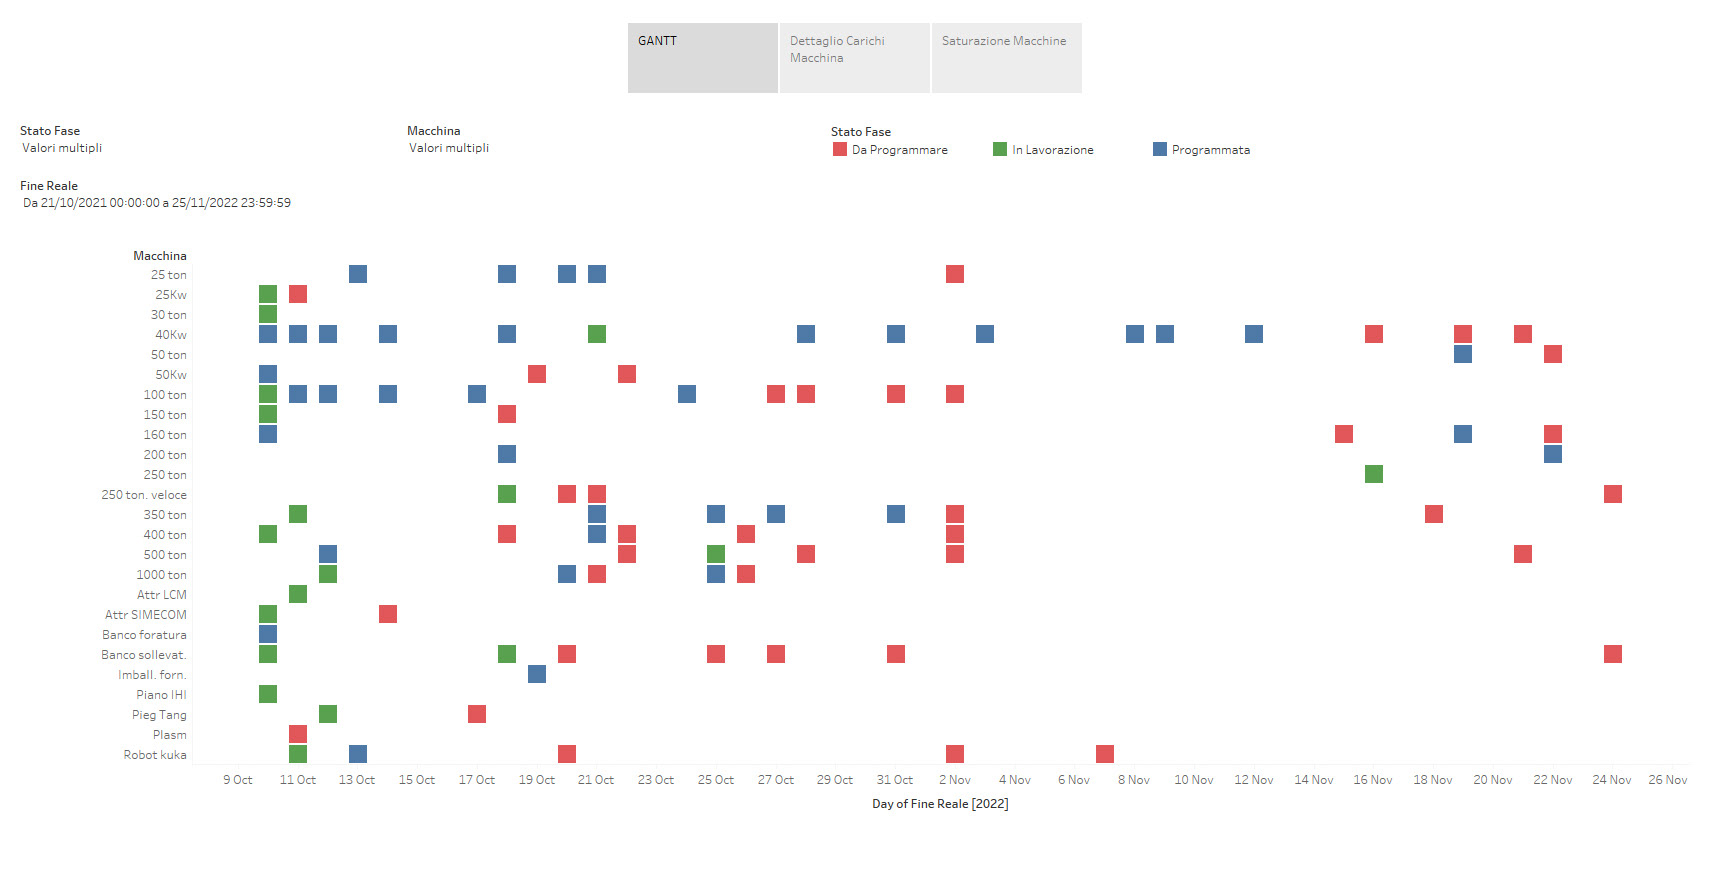
PRODUCTION PLANNING
The planning manager can have an overview of the production floor with 3 simple views:
- A visual Gantt of all the machines with their existing order scheduling based on the information on the technical sheet of every article
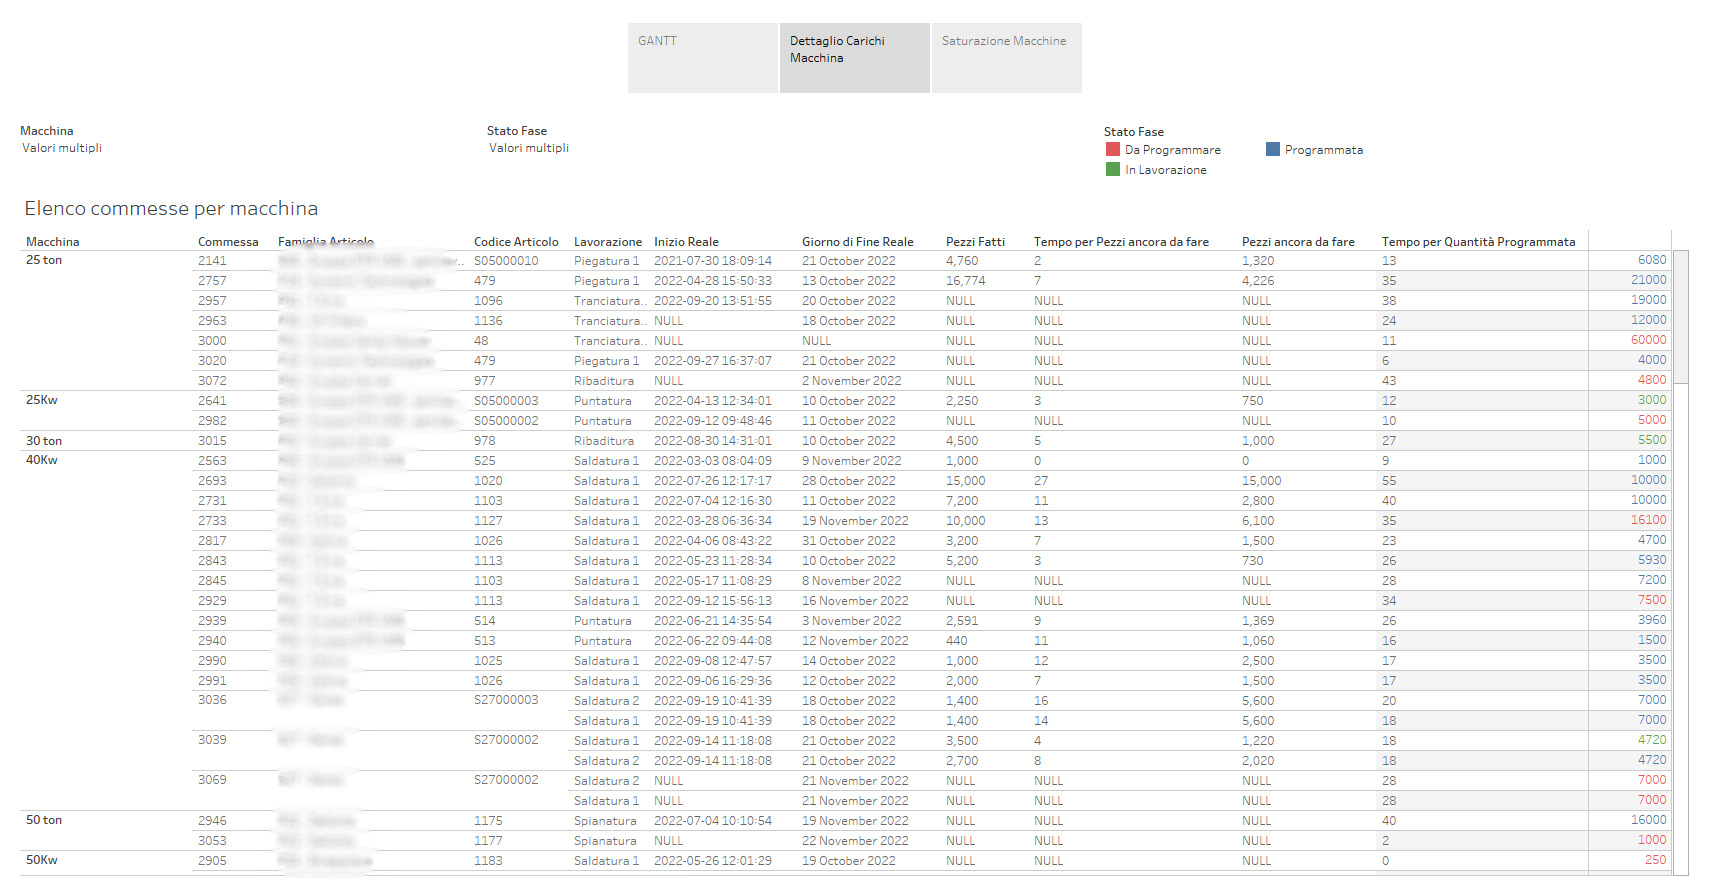
- A table with all the information of status and scheduling of every production order
- A table aided by an outright chart with the workload of every operating machine for any open production order

PRODUCTION STREAM
More of a motivational visualization and a rapid alert for the production manager than an actual report, in 2 views we have:
- A live stream of all parts produced as soon as a new box is created and labeled
- All the "production events" with the name of the operator that has executed it (coil change, machine stop, machine start, box created, alert, ....)


WAREHOUSE EVALUATION
A singular view that evaluates any article in the warehouse based on the purchase price (in the case of the raw material and components) or the price lists (in the case of finished goods). To have a simplistic but easy idea of the cashflow stuck in the material and incentivize inventory control.

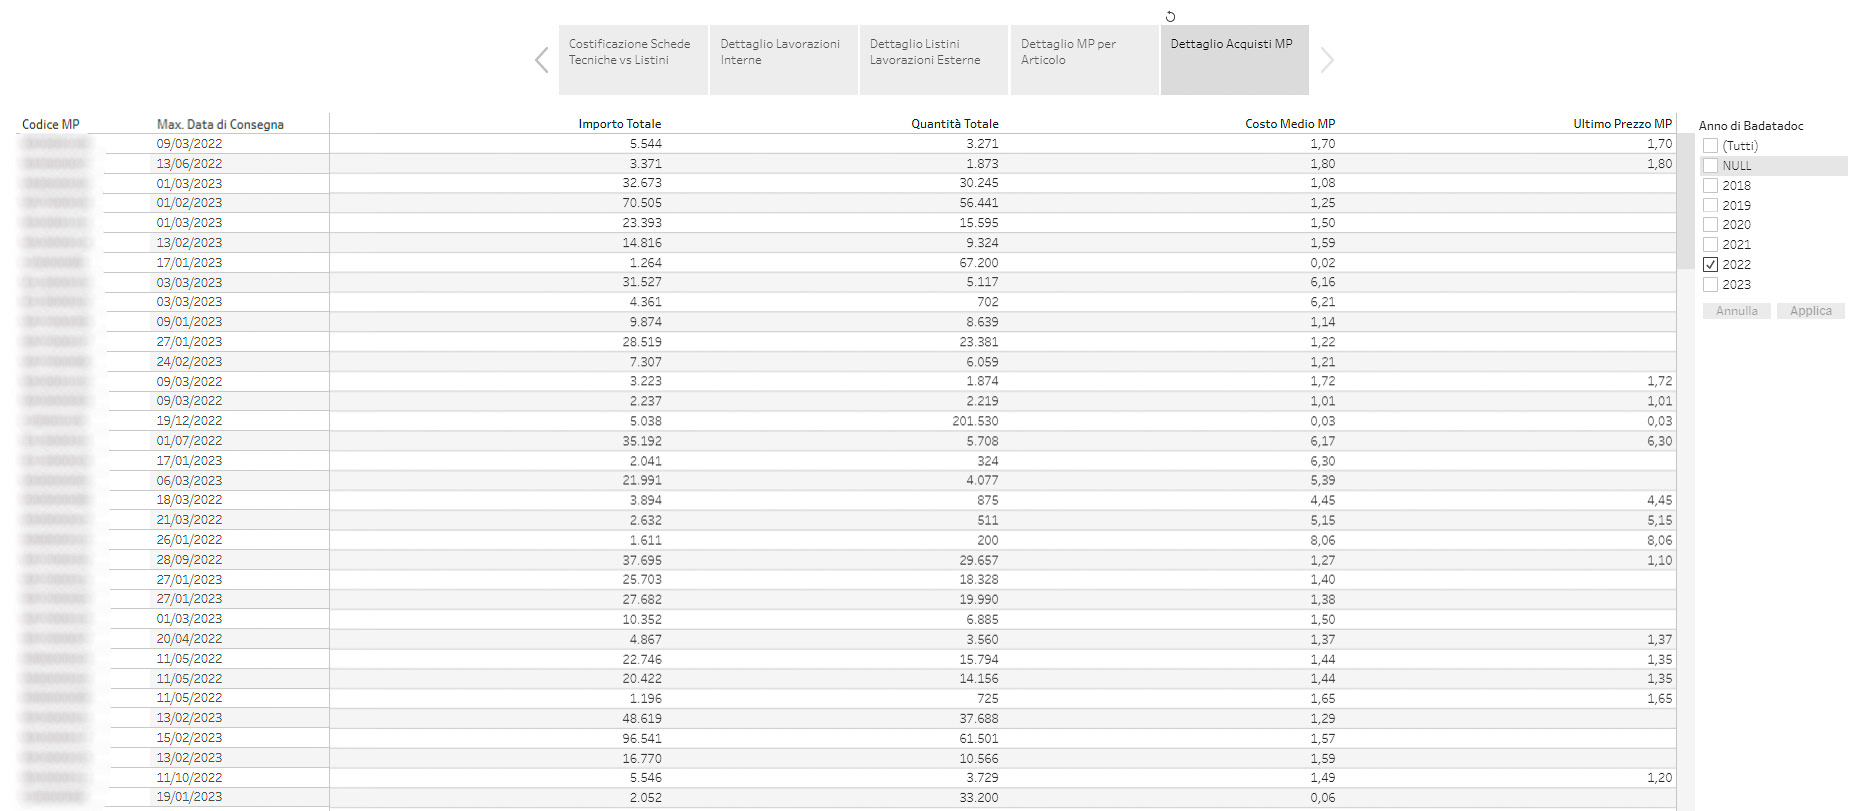
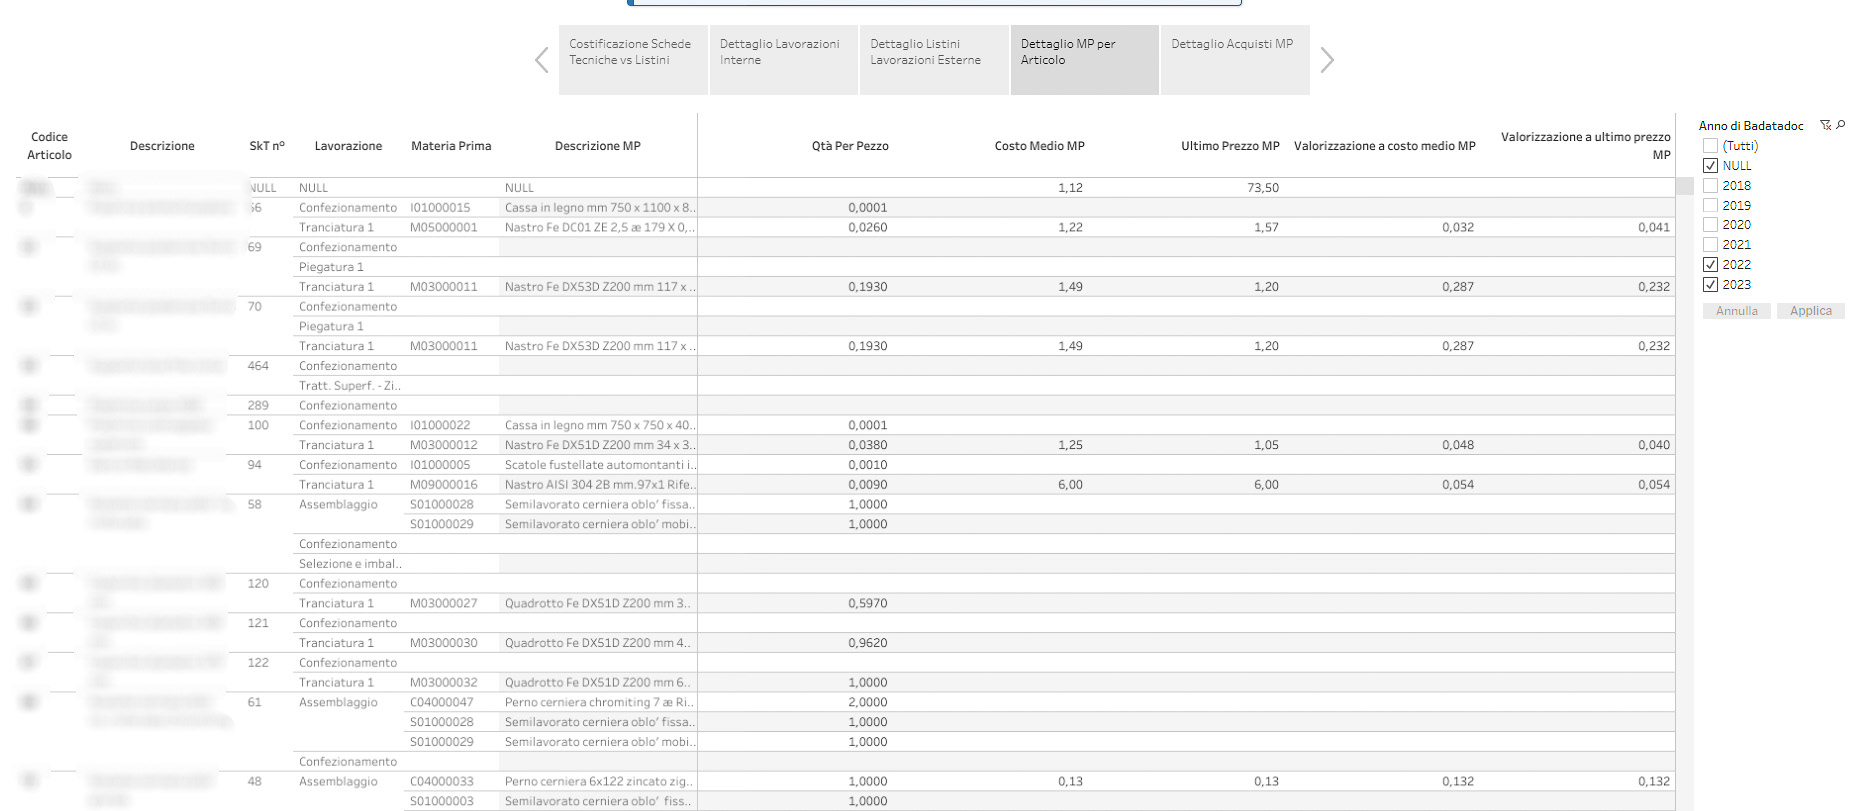
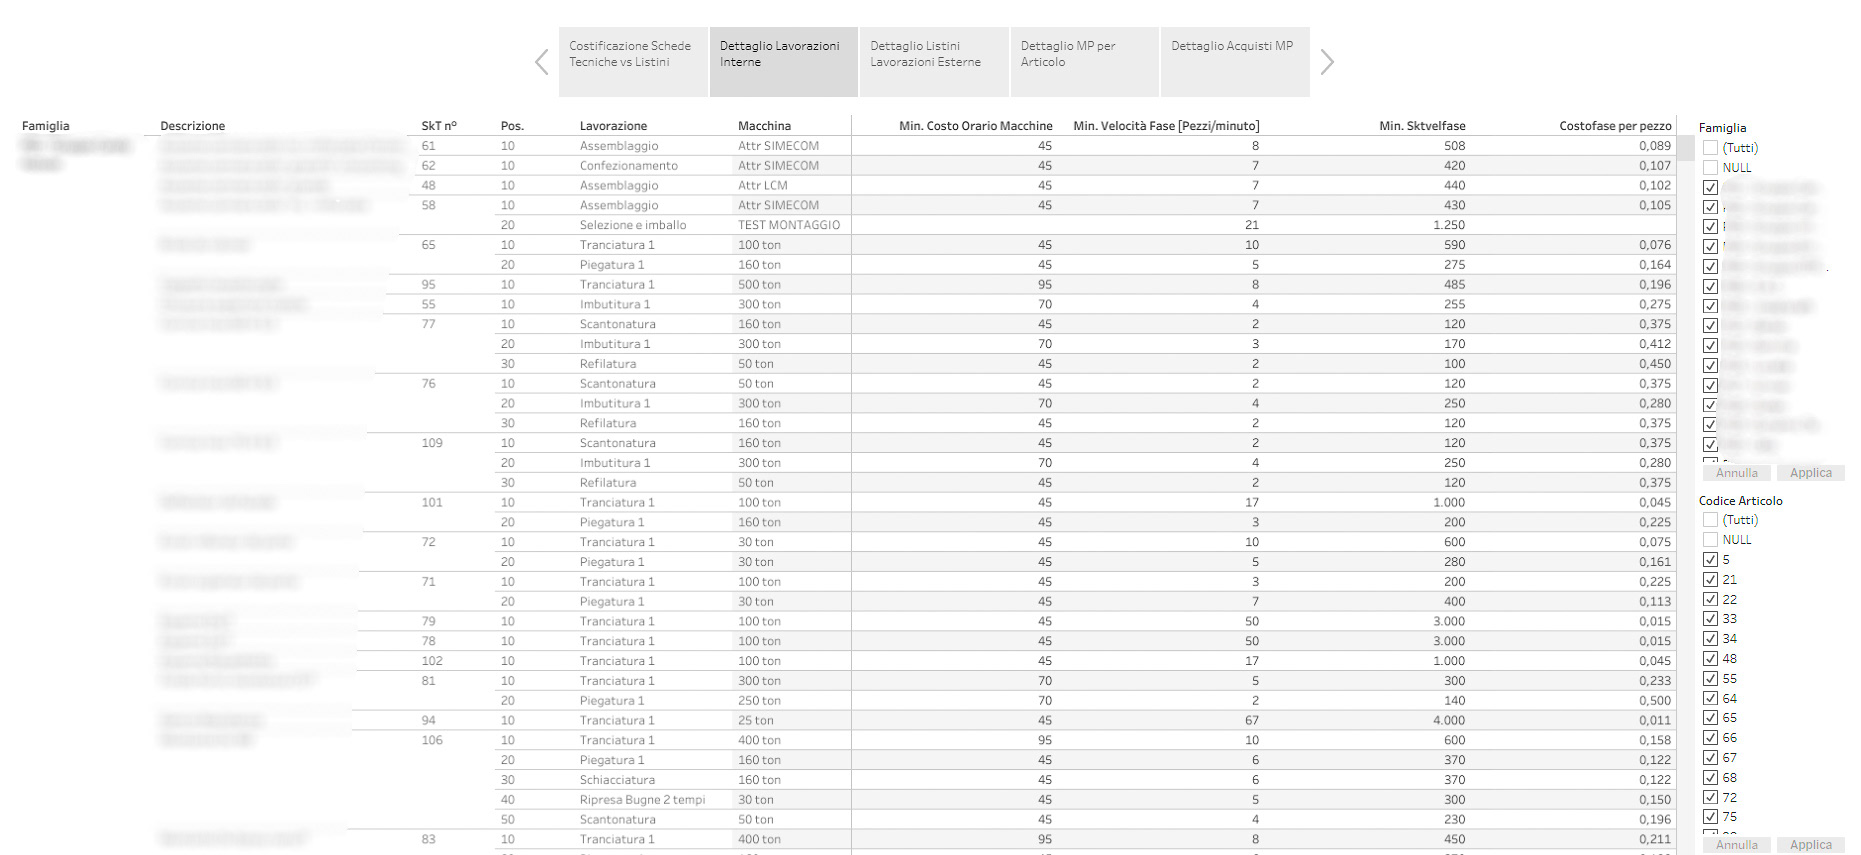
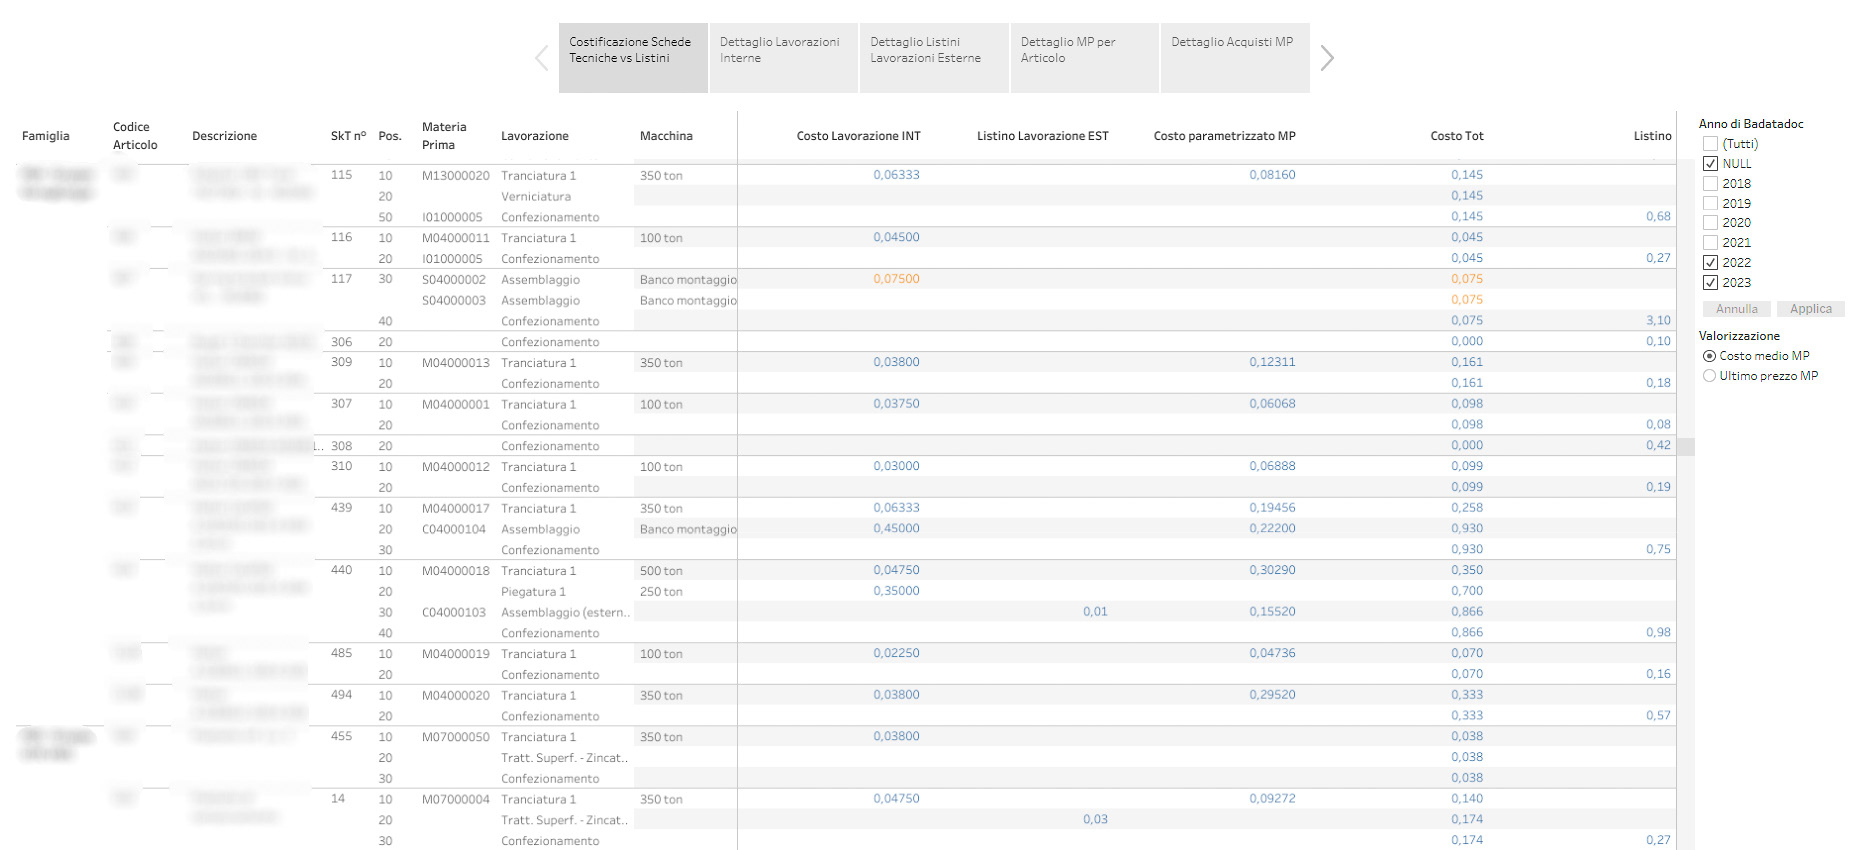
PRODUCTION COST CONTROL
The production and controlling managers can have an overview of the production costs with 3 simple views and a general recap article by article:
- A table with all the purchases of the raw materials, evaluated using the last price or its average through any time period requested
- A table with the evaluation of the raw material needed for every article, also evaluated uysing the last price or its average
- A table with all the latest or average price lists for any external process phase
- A table that evaluates every industrial cost crossing data between flow charts and technical sheets with price lists reporting all the costs per hour of machinery and operator
- A recap that, for every article produced, report an estimate of the total industrial costs (raw material + use of facilities and employees + eternal costs) at every step of production (semifinished and finished product) and compare it with the final customer's price list
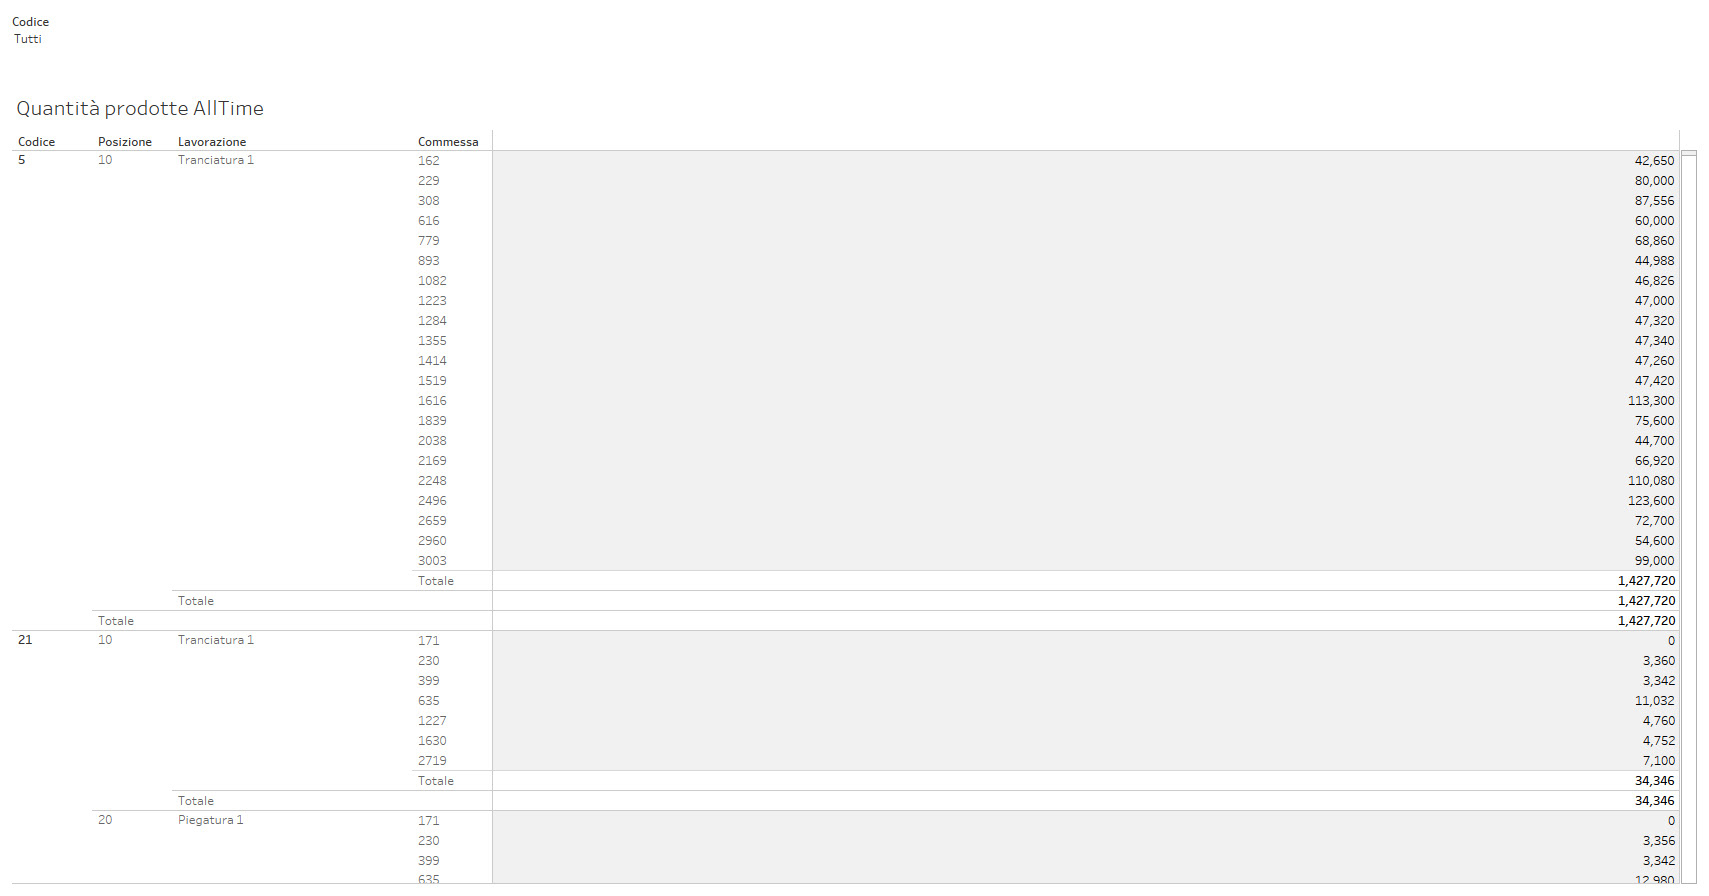
QUANTITY PRODUCED ALL TIME
This is a very simple view used by the tooling department to schedule and verify the tool maintenance: a table showing any article and all the parts produced anytime.
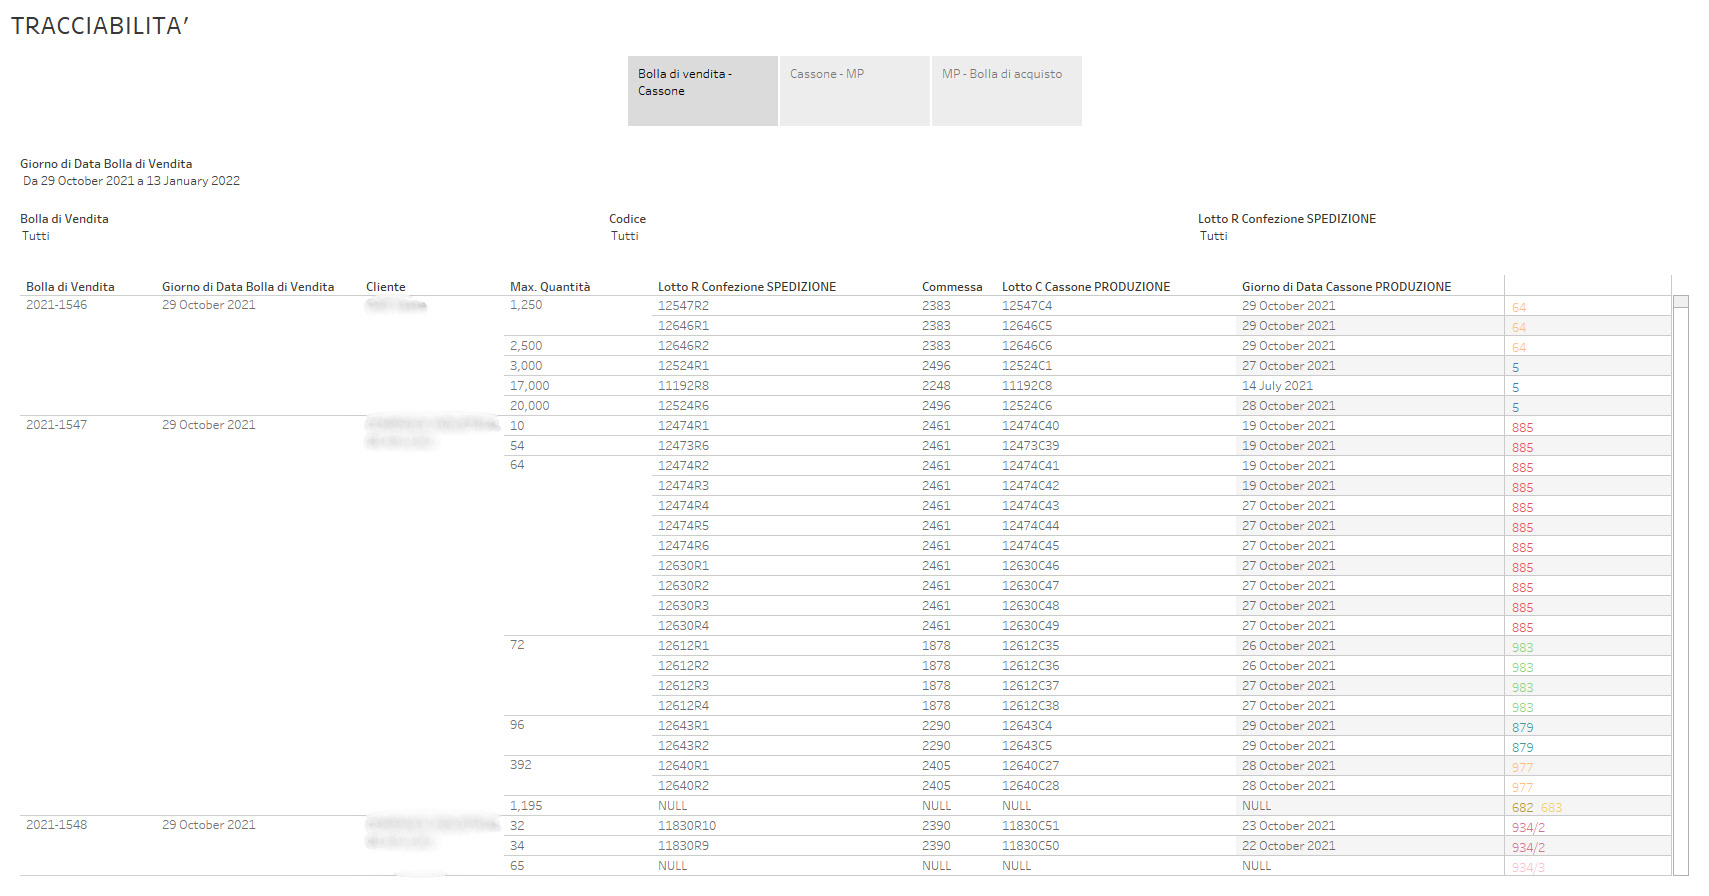
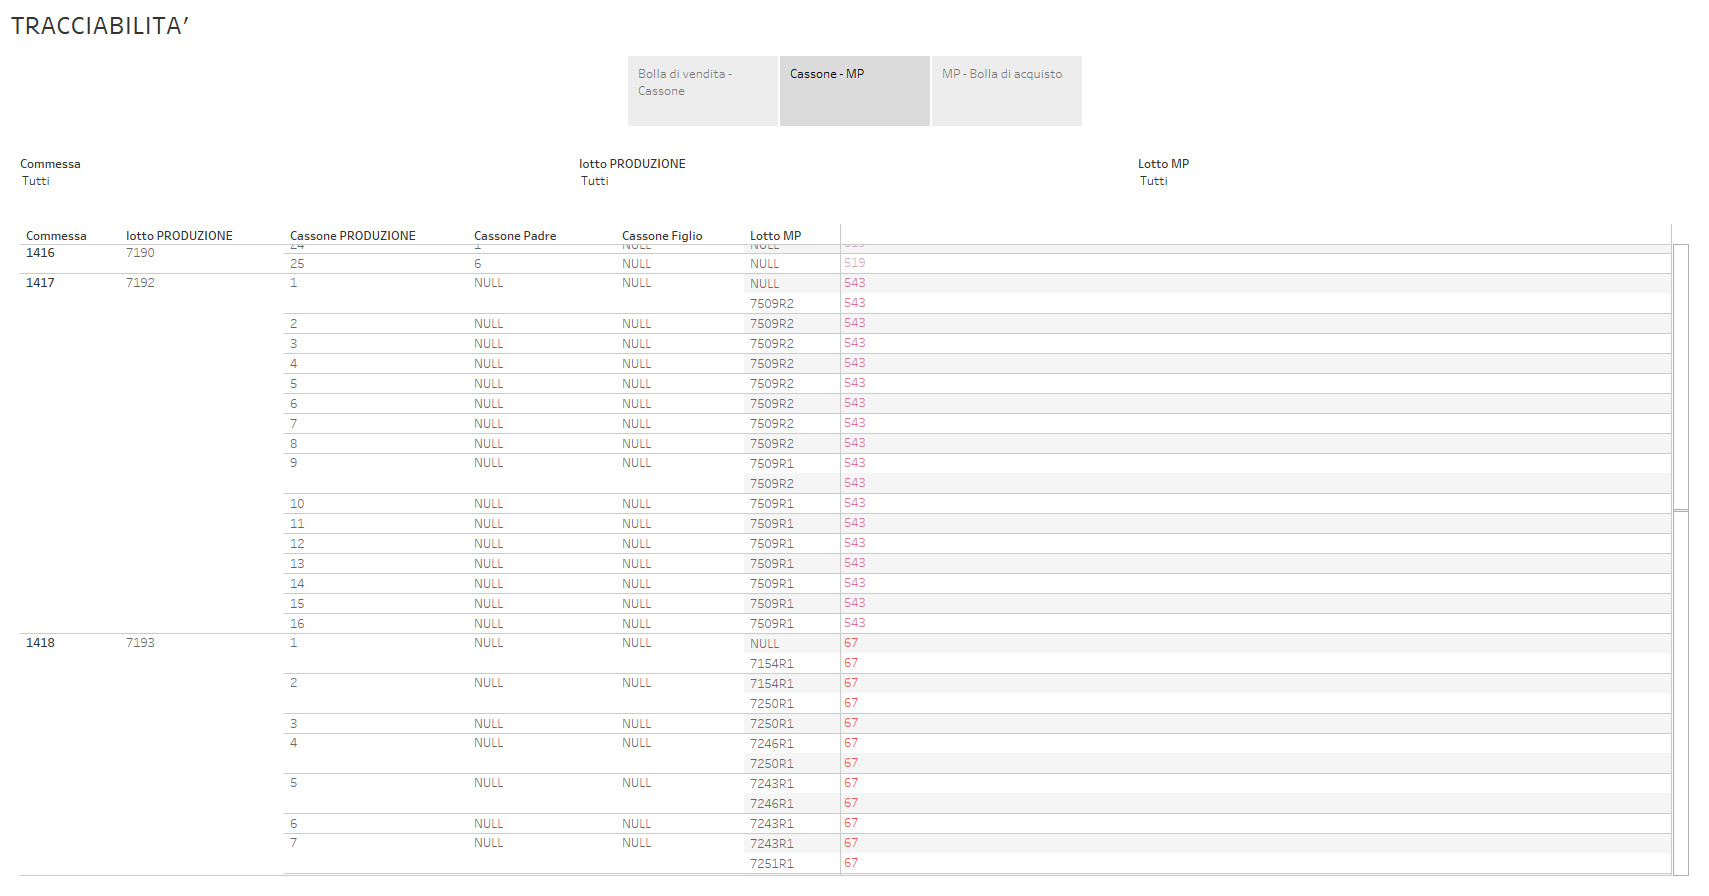
LIVE TRACKING
The most beloved Tableau story by our customers; it allows the quality manager to have through 3 different but interconnected views the complete traceability of any processed part:
- A table that shows for every document of transport all the shipping batches and the correspondent production batches
- A table that connects any production batch with the raw material batch and its production order and time
- A final table to get the supplier information on any raw material batch: delivery time, casting, supplier batch, document of transport

The next steps are to widen the amount of data tables available and, with some training, to build a "data culture" that can lead to a enriching conversation between the people in charge of maintaining and upgrading this tool and any other member of the organization. In this way, we will empower anyone with the data they didn't know we had and didn't know they needed.